How to Use Salesforce Reports and Dashboards to Make Better Business Decisions
As a business owner, you are constantly making decisions that can impact your bottom line. Whether it’s deciding which products to stock or which marketing campaign to invest in, making informed decisions is key to success. Fortunately, Salesforce offers on-demand reports and dashboards that can help you make better decisions based on real-time data.
In today’s fast-paced business environment, the ability to make quick and informed decisions is critical to success. With Salesforce on-demand reports and dashboards, you can have access to live data that enables you to take better decisions and stay ahead of the competition.
Introduction
Salesforce is a cloud-based customer relationship management (CRM) platform that allows businesses to manage customer interactions and automate sales, marketing, and customer service processes. One of the most powerful features of Salesforce is its ability to provide the latest data through on-demand reports and dashboards.
On-demand reports allow you to generate reports on-the-fly, giving you access to up-to-the-minute data. Dashboards, on the other hand, provide a visual representation of your data, allowing you to quickly identify trends and patterns. Together, these tools give you the ability to take better decisions based on live data.
Getting started
In this article, we will discuss the best practices for taking advantage of Salesforce reports and dashboards to make data-driven business decisions.
Firstly, it is important to ensure that your Salesforce data is accurate and up-to-date. Data quality is crucial for making informed decisions, and you need to ensure that your data is clean and consistent. This will help you to identify trends and patterns in your sales performance and make accurate forecasts.
Secondly, you need to identify the key performance indicators (KPIs) that are most important to your business. This will help you to focus on the metrics that matter and measure your success against your goals. You can then use Salesforce reports to track your progress against these KPIs and identify areas for improvement.
Thirdly, you should store the reports in one or more key folders and make sure users know where to find them. This will make it easy for team members to find the reports they need in a couple of clicks.
Finally, you should check with users that the reports and dashboards are easy to understand and give them the information they need. This is vital so they can truly make informed decisions.
Once Salesforce is fully aligned with your business goals and objectives, you can ensure its being used to its full potential and driving better business outcomes.
How On-Demand Reports Can Help You Make Better Decisions
Salesforce reporting tools allow you to access data from Salesforce and create custom reports based on the data that is most relevant to your business. By customizing your reports, you can focus on the specific metrics that matter most to your business. On-demand reports can be customised to allow you to filter, sort, and group your data to meet your specific needs. You can create reports on anything from sales performance to customer demographics to project progress.
With on-demand reports, you can quickly identify trends and patterns in your data. For example, if you notice that sales for a particular product or service are declining, you can drill down to see which regions are underperforming. This allows you to make informed decisions about which products and services to focus on.
You can also use on-demand reports to track customer satisfaction. For example, if you notice that many customers are submitting low scoring feedback, you can investigate the root causes and take steps to improve.
How Dashboards Can Help You Make Better Decisions
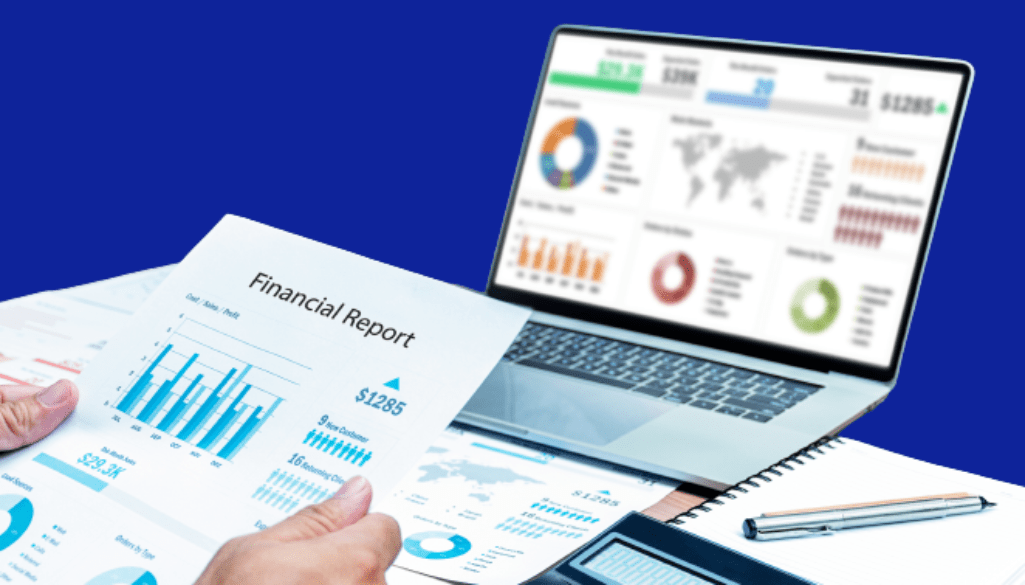
Dashboards are visual representations of your data that allow you to quickly identify trends and patterns. They provide a high-level view of your data and can be customised to meet your specific needs.
With dashboards, you can track key performance indicators and see how your business is performing in real-time. For example, you can create a dashboard that tracks sales by product, region, or sales rep. This allows you to quickly identify areas of the business that are underperforming and take action to improve them.
You can also use dashboards to track customer behaviour. For example, you can create a dashboard that shows the number of website visitors, the number of leads generated, and the number of sales made. This allows you to identify trends and patterns in your customer behaviour and make changes to your marketing strategy accordingly.
How On-Demand Reports and Dashboards Work Together
On-demand reports and dashboards work together to provide a complete picture of your business. On-demand reports allow you to drill down into your data to identify trends and patterns, while dashboards provide a high-level view of your company performance.
For example, you may notice that sales for a particular product are declining in a specific region. You can drill down into your data using an on-demand report to see which sales reps are responsible for that region. You can then create a dashboard that tracks the performance of those sales reps, allowing you to quickly identify areas that need improvement.
Types of Reports and Dashboards
Salesforce offers a wide range of reports and dashboards to help businesses analyse their data and make informed decisions. Reports can include charts and column summaries (eg totals and averages). Data from reports can also be exported as Excel and CSV files.
The 2 main types of report are:
Tabular Reports
Tabular reports are simple, straightforward reports that display data in rows and columns. They are the most basic type of report in Salesforce and offer several benefits, including:
1. Easy to create and use, even for non-technical users.
2. Provides a quick overview of data in a simple format.
3. Can be customised to show only the relevant data, which helps users to identify trends and patterns.
Summary Reports
Summary reports are a more advanced type of report that allows users to group data and display it in a summary format. Benefits of using this type of report include:
1. Provides a high-level overview of data in a summarised format, which helps users to identify trends and patterns quickly.
2. Allows users to group data by specific criteria, which makes it easier to analyse data based on different parameters.
3. Provides a better understanding of data compared to tabular reports.
Dashboards
A dashboard is a visual representation of data that allows users to monitor key performance indicators (KPIs) and track progress towards goals. They offer several features and benefits, including:
Benefits:
• Provides a comprehensive overview of data in a single view, which helps users to identify trends and patterns quickly.
• Enables users to track progress towards goals and identify areas for improvement.
• Helps users to make informed decisions based on real-time data.
Conclusion
In today’s fast-paced business environment, the ability to make quick and informed decisions is critical to success. With Salesforce on-demand reports and dashboards, you can have access to real-time data that can help you make better decisions and stay ahead of the competition. By using on-demand reports, you can drill down into your data to identify trends and patterns, while dashboards provide a high-level view of your KPIs. Together, these tools can give you the information you need to take informed decisions that can positively impact your bottom line.
In conclusion, if you want to make the best decisions for your business, following the steps in this article will provide you with valuable insights that can help you stay ahead of the competition. So why wait? Start using Salesforce today and take your business to the next level.
Start Your Transformation Now
Send us a message if you believe we may be a good fit for your next Salesforce project.
We would be delighted to have a conversation to hear about your needs and explain how we operate.


